THIS Most Important U.S. Stock Market Indicator You Need to See!
Support My Work: https://www.patreon.com/themoneygps
PayPal: https://goo.gl/L6VQg9
BitCoin: 1MbAUXsHa8XRFMHjGurd7L5nRDYJYMQQmq
Look In My Book!: http://book.themoneygps.com
My Free eCourse to Unveil the TRUTH:
http://themoneygps.com/freeecourse
Tools You NEED to Prepare for the COLLAPSE:
http://themoneygps.com/store
********************************************************************
Sources:
^W5000 Interactive Stock Chart | Wilshire 5000 Total Market Index Stock - Yahoo Finance
Wilshire Associates - Wilshire 5000 Total Market Index
https://wilshire.com/indexinfo..../Wilshire-5000-Total
The Wilshire 5000 Total Market IndexSM is widely accepted as the definitive benchmark for the U.S. equity market, and measures performance of all U.S. equity securities with readily available price data
Stock market indicators QE interest rates
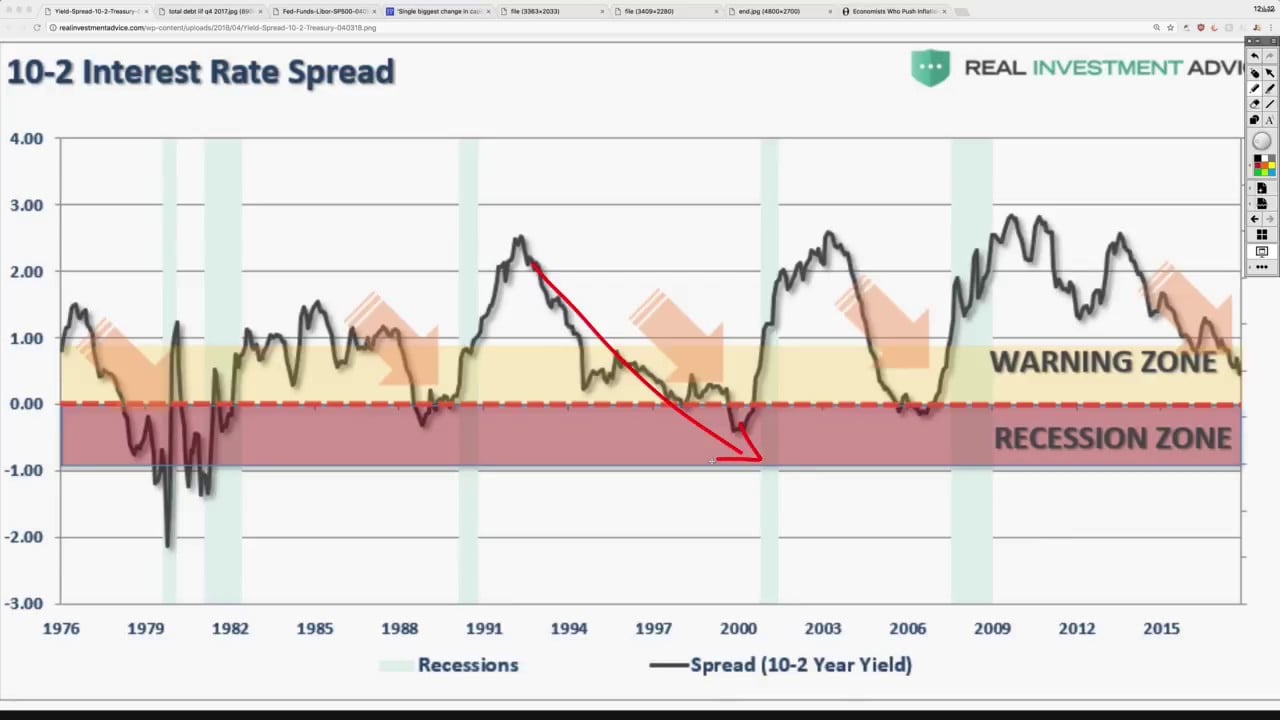
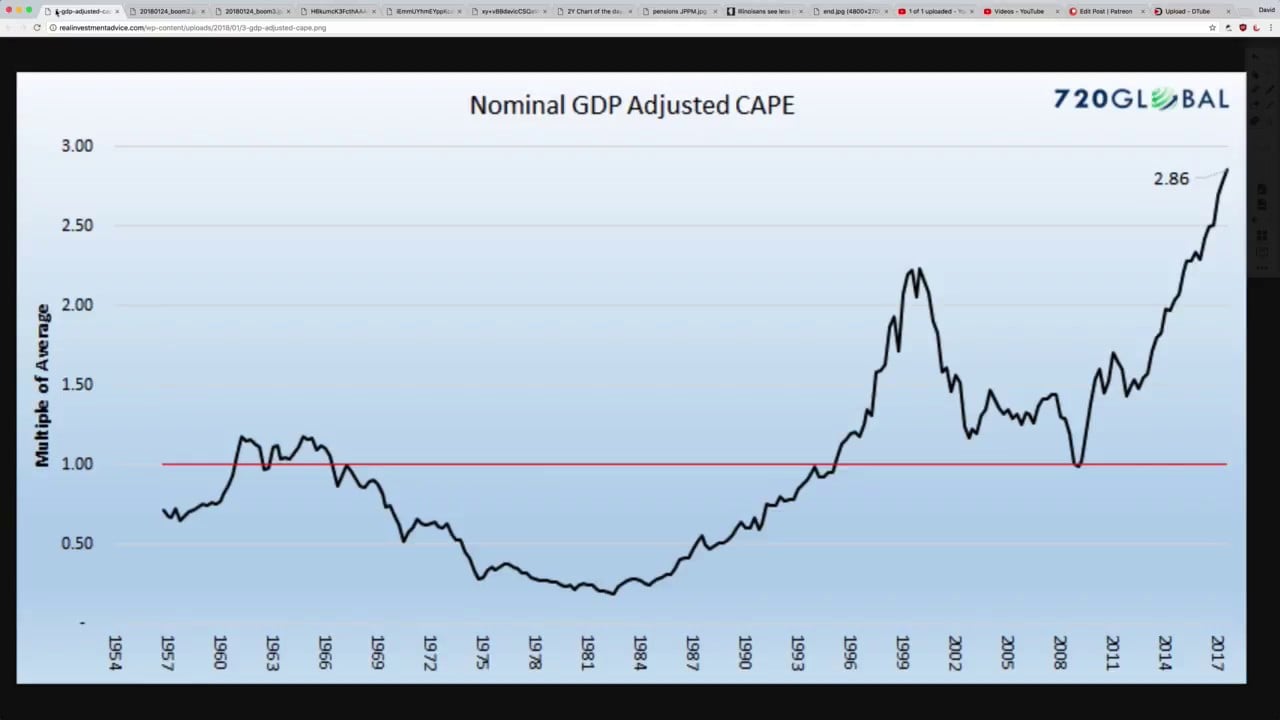
Stock markets are constantly moving erratically. It has become a chore to be able to monitor and understand the movement and the ripple effect. While there are thousands of important indicators, some offer more information and usefulness than others. This one chart can be compared against so many others and tell us a grand picture of what is really going on and where we can expect it to go.


