

Video Player is loading.
This is a modal window.
No compatible source was found for this media.


TTOR
423 Views


Micah
610 Views


Gee Gee Tee
830 Views

IEnjoyCreatingVideos
600 Views

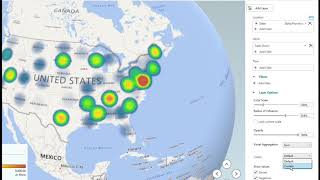
How to Use 3D Data Maps to Show Sales per State with 2d Graph in Microsoft Excel

Micah - 425 Views
0
0
Published on 09 Feb 2019 / In Film and Animation
How to Use 3D Data Maps to show Sales per State with 2d Graph in Microsoft Excel
Support my channel (for free) and find my other platforms here - https://linkkle.com/micahdjohns
Here's a list of resources that can help you make money - https://linkkle.com/makemoney
Show more

0 Comments
sort Sort by
TTOR
423 Views
Micah
610 Views
Gee Gee Tee
830 Views
IEnjoyCreatingVideos
600 Views